Data Analytics on Data Analytics
Purpose
Data Engineering, Analytics, Science & corresponding Machine Learning Engineering can be an overwhelming field with an even more overwhelming amount of tools that might be necessary for landing a job in that business. Hence, in order to better understand if I am on the right path with Excel, SQL, Python and PowerBI as my go-to tools, I decided on checking in on current job descriptions and the demanded skills.
Again, with Selenium (see Price Research project) I scraped Indeed.com for job postings in Munich, showing up for the keywords…
- Data Analyst (DA)
- Data Scientist (DS)
… as these are the jobs I am most interested in, and for which I learned the most through courses. And I added…
- Business Analyst (BA)
- Business Intelligence (BI)
… to the list, since I am / was working in BI at IVECO. Additionally, I need to note that I did not actively look for jobs in…
- Data Engineering (DE)
- Machine Learning Engineering (MLE)
… since I do not see myself fully qualified for this positions, yet! However, as you will see, some job postings for DE & MLE showed up nonetheless.
Methods
I followed the classic ETL procedure
Extract
As mentioned before, I used the Selenium library, for the reason that it was necessary to click each job-beacon in order to open up the job descriptions. I will not go in-depth for the scraping part once more (see Price Research project). However, the code is still available here. For it to work on your computer, you require the latest version of both, the Microsoft Edge driver and the Microsoft Edge browser. The file needs to be started through the command line, whilst passing an argument in for the number of pages for each job, that should be scraped. For example, 5 pages…
python IndeedScraper.py 5
For this project, I spread the scraping over many days, for two reasons:
- Not being flagged by Indeed as a bot (in case they had an algorithm that was trying to catch some).
- Still achieving a great sample size.
The result were dozens of csv-files that needed to be merged first. Thankfully the python provides a neat solution to this.
import pandas as pd
from glob import glob

files = glob('Data/data*.csv')
dfs = []
for file in files:
 dfs.append(pd.read_csv(file, parse_dates=['Scraped_Date']))

df = pd.concat(dfs)
Transform
Next, I transformed the Job Title and Posting Description into valuable information. For that, I defined dictionaries of regular expression patterns that extracted a job position and a job level (e.g. Junior, Senior, Manager…) out of the Job Title, and demanded skills out of the Job Description. In interaction with a function, that can apply to a dataframe, the code looked like this:
import re as regex

def check_job_position(job):
    job_title = job.Job_Title
    for position, pattern in position_patterns.items():
        if regex.search(pattern, job_title):
            return position
    return 'Other'

position_patterns = {
    'Data Scientist' : 'Data.*[Ss]cien(ce|tist)', 'Data Engineer': 'Data.*[Ee]ngineer',\
    'Data Analyst': 'Data.*[Aa]naly(st|tics)', 'Business Analyst': 'Business.*[Aa]naly(st|tics)',\
    'Business Intelligence': 'Business.*[Ii]ntellig|BI\W', 'Machine Learning': '[Mm]achine.?[Ll]earning'
    }

df['Position'] = df.apply(check_job_position, axis=1)
As a result, you have column called Position that takes the value of the first key, for which the Job Title matched the pattern of the value. You can see the full transformation code here: Deepnote
Load
Well, yeah… I loaded the results into a new csv file for further analysis. But that’s it.
df.to_csv('full_data.csv', index=False)
Analysis
Here comes the fun part.
Exploratory Data Analysis (EDA)
First of all, I did a little bit of data exploration. Keep in mind, that these numbers can change as I keep scraping more job postings.
Descriptive
After removing duplicates, the dataset contained 750 job postings offered by 440 different companies. 524 fell into one of the previously mentioned categories:
| Job | Abbreviation | Count | Share |
|---|---|---|---|
| Business Analyst | BA | 172 | 22.9% |
| Data Scientist | DS | 140 | 18.7% |
| Data Analyst | DA | 122 | 16.3% |
| Business Intelligence | BI | 58 | 7.7% |
| Data Engineer | DE | 28 | 3.7% |
| Machine Learning Engineer | MLE | 4 | 0.5% |
It needs to be mentioned that the magnitude of each category does not necessarily indicate the demand for that particular position, as the bottom two categories were never directly queried. Furthermore, during the scraping process errors could occur, e.g. a job posting was not clickable or during one scraping routine Indeed.com became unresponsive, resulting in the key word Business Intelligence to have been scraped only half that long than any other key word on that day. However, I can live with that, as the top 3 positions are currently of most interest for me, and BI being the job I am currently holding. Having a sub-sample size of over 100 is a good start.
Companies of interest
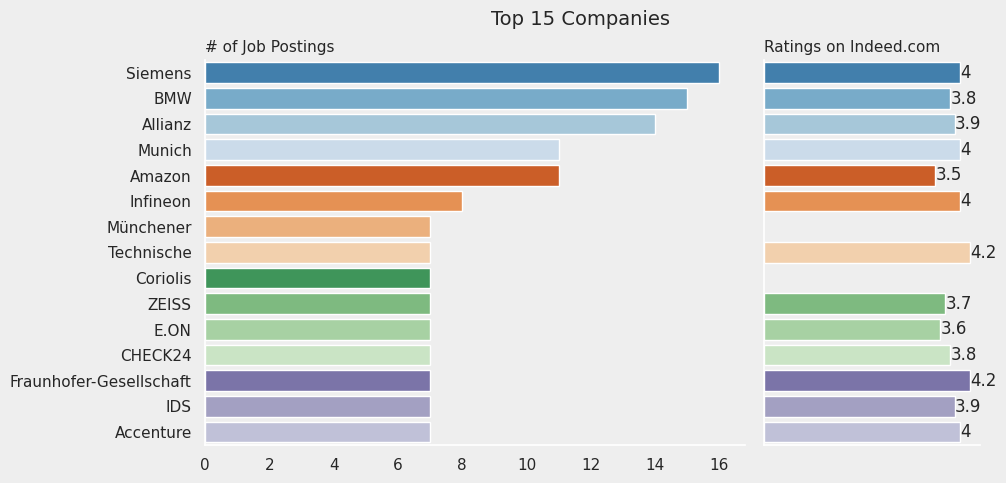
One key characteristic I am looking for in an employer is a growing data team, where I can learn and collaborate with others. I also wanna avoid any DA job that deep down is actually a DE job. Hence, I took a closer look at the top 15 companies with regards to job offerings found and their rating on Indeed.com

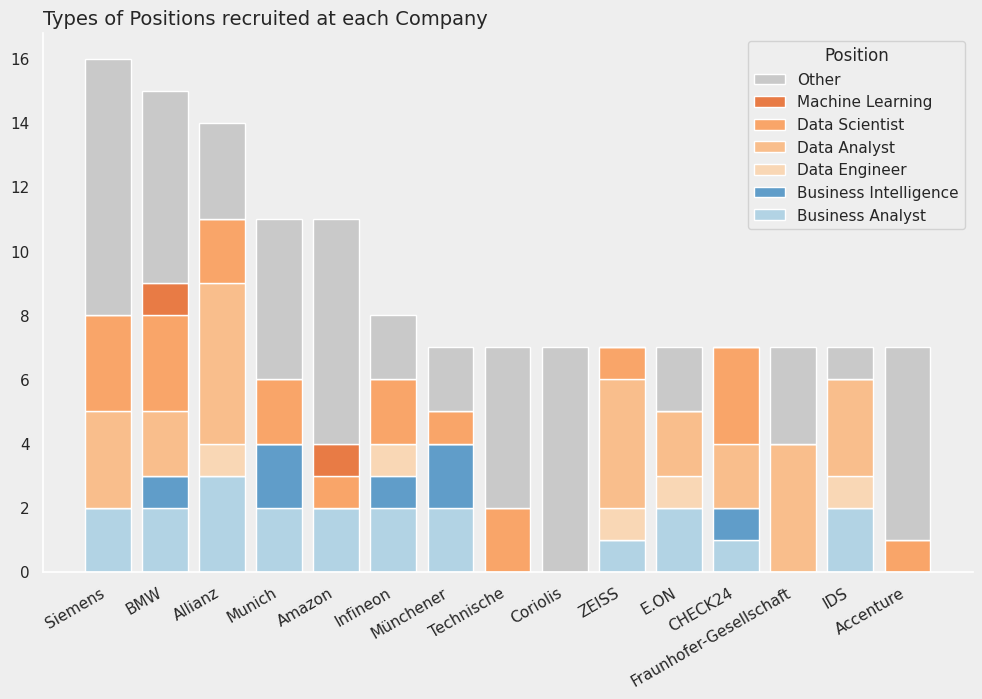
As a follow up, I wanted to see what type of positions they were offering. Blue and orange emphasized business driven and data driven jobs, respectively.

Companies hiring a DE is already a big plus, as it is an indicator that the fundamental infrastructure for a data team is or will be built. Having a DS in the company can also be beneficial for my growth as a data worker, because you can always learn a thing or two from DS. As a conclusion, Siemens, BMW and Allianz are on a hiring spree, which probably has to do with their HQs being located in Munich. For Allianz, Infineon, E.ON, IDS, and ZEISS I can say with confidence that DE will be at place. As a last resort BMW, Allianz and Munich RE provide plenty BI and BA jobs that could serve as an entry job, and from which I then could be internally hired as a Data Analyst.
The complete jupyter notebook (with less description) is available here: Deepnote
A more extensive data visualization can be found on Tableau